How scientific figures should work in 2014
I recently asked myself if it is possible to say, based purely on tweets, whether it’s sunny in San Francisco or not. So I recorded all tweets from Tue Jan 21 12:33:21 UTC to Sat Jan 25 13:36:16 UTC, limited to a bounding box of: ['-122.75', '36.8', '-121.75', '37.8']
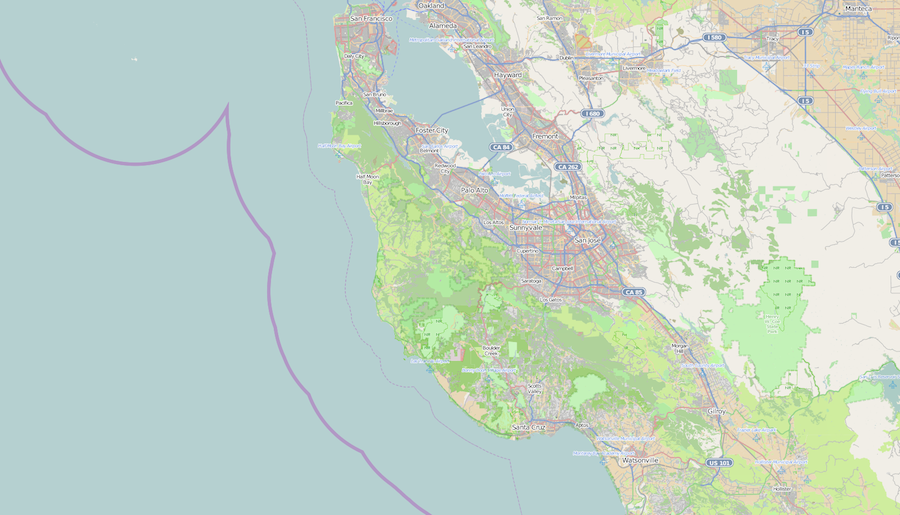
Well, it’s really the wider Bay Area, not just San Francisco. I really need to check the bounding box is absolutely correct (it’s a bit too broad, potentially messing up my analysis) before collecting gigabytes of data next time. For what I want to show you, however, it will do just fine.
I also recorded weather data for this period of time. In total, 318530 tweets and 5791 weather reports were analyzed. My hypothesis states that if there is greater cloud coverage, people are less likely to tweet about how sunny it is, or other sun related things. Specifically, I defined a sunny tweet with a simple regex, like so: /\b(sunny|☀|soleado|sunshine|太陽|sunlight|#sun)\b/i. So if any of those words (or emoji, or hanzi) appear in a tweet, it’s classified as sunny.
So after analyzing this data, I, like many other researchers in the field of tweet-based weather forecasting, made a figure (shown below). And because I’m a progressive guy, the figure is in a vector SVG format, which makes it very easy to use it everywhere, as vector images can be scaled without loss of quality.

Going a step further, practically on the bleeding edge of science publishing, I put the archive of data used to build this figure on Figshare and the code that was used to analyze it on GitHub. This is about as far as I’ve generally seen people take scientific data analysis publishing, i.e.: you publish the data and you publish the code that uses that data.
But why not take it a step further still?
As soon as I stopped recording tweets and weather reports yesterday, this analysis, and with it the figure above, became outdated and possibly incorrect. But why should it? The weather reports haven’t stopped coming in, and the Twitter streams are not ending anytime soon either. So why stop the experiment? You're right, we shouldn't. I believe that as long as the required data is available, the experiment must go on!
This is where publishing science on the web can really shine. Science published on paper is static, a point-in-time snapshot of a world that never stays still. Science published on the web, on the other hand, can and should be dynamic, providing an accurate perspective of the ever-changing reality. In other words, publishing on the web can make science alive.
Let’s make it so!
The figure you see above is a living figure with ongoing data analysis on live data, coming from Twitter and the weather data API (hat tip to OpenWeatherMap). You will notice that it looks different from the original figure, the trendlines are different and the range of data is different, and that’s kind of the point.
In fact while you were reading this blogpost, an additional {{numberNewProcessed}} tweets were processed, bringing the grand total to {{numberProcessed}}.
Right now, based on {{ smtps | number:0 }} micro-sunny tweets per second on average in the last hour my analysis is predicting {{(smtps - leastSquaresCoeff[1]) / leastSquaresCoeff[0] | number:0 | minmax }}% cloud coverage, and the actual cloud coverage is {{ clouds[clouds.length-1].coverage}}%. Room for improvement.
Just for kicks, the latest sunny tweet goes a little something like this: {{sunnyTweets[sunnyTweets.length-1].tweet}}. So deep.
Conclusion
There you have it. While this is a slightly convoluted example, there are a lot of cases where the data that was needed to create an analysis or figure is still being created, and the figure is obsolete from the day it gets published or even sooner. Think genomes, Hadron collider data, astronomical measurements, economy indicators, clinical trials, systems biology experiments, ... the list goes on and on. A great example is a continuous stream of data from an OpenEHR API: why wouldn’t that retrospective study on pancreatic cancer survival using drug X be a living research object, updating itself as long as the data keeps coming? And in the vast majority of cases, the data will keep coming. However, it is up to us to make sure it lives up to its potential.
Comments are welcome on Twitter or e-mail, especially since I’m a "noob" using Node.js, D3, SVG, WebSockets, AngularJS, and would love feedback on the technology or approach. Pull requests are also more than welcome!
Update
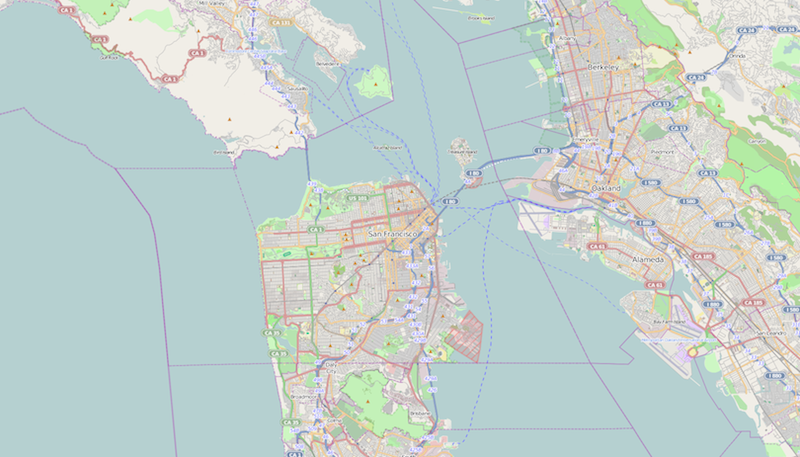
Updated my bounding box, so it is more limited to San Francisco.
I’ve also started capturing the correct hanzi, thanks to @cvellage. I will rerun the initial analysis with these new parameters later today (still 5 AM right now), but the live process is already taking them into account. It’s also very possible I need better weather data/API, all suggestions are welcome; needs to be open, free and have historic data available.