Standards for scientific graphic presentation
TL;DR: Over the previous hundred years, a lot of work has gone into standardizing the way scientific data is presented. All of this knowledge has been largely forgotten. I want us to bring it back to life.
Before we talk about science, let’s take a short but scenic detour. A few months ago, while scrolling through the latest popular Kickstarters (it’s a good way to get motivated to get out of bed), I came across this fantastic project: Full size reissue of the NYCTA Graphics Standards. You see, in the 1960s, taking the subway in New York was a chaotic experience.

While walking down the stairs of a subway entrance, once you were lucky enough to find one, you were bombarded by a cacophony of diverse signs that took quite a lot of mental effort to grasp. Figuring out exactly which train you have to take from which platform1 on which side and at which time, was far from trivial.

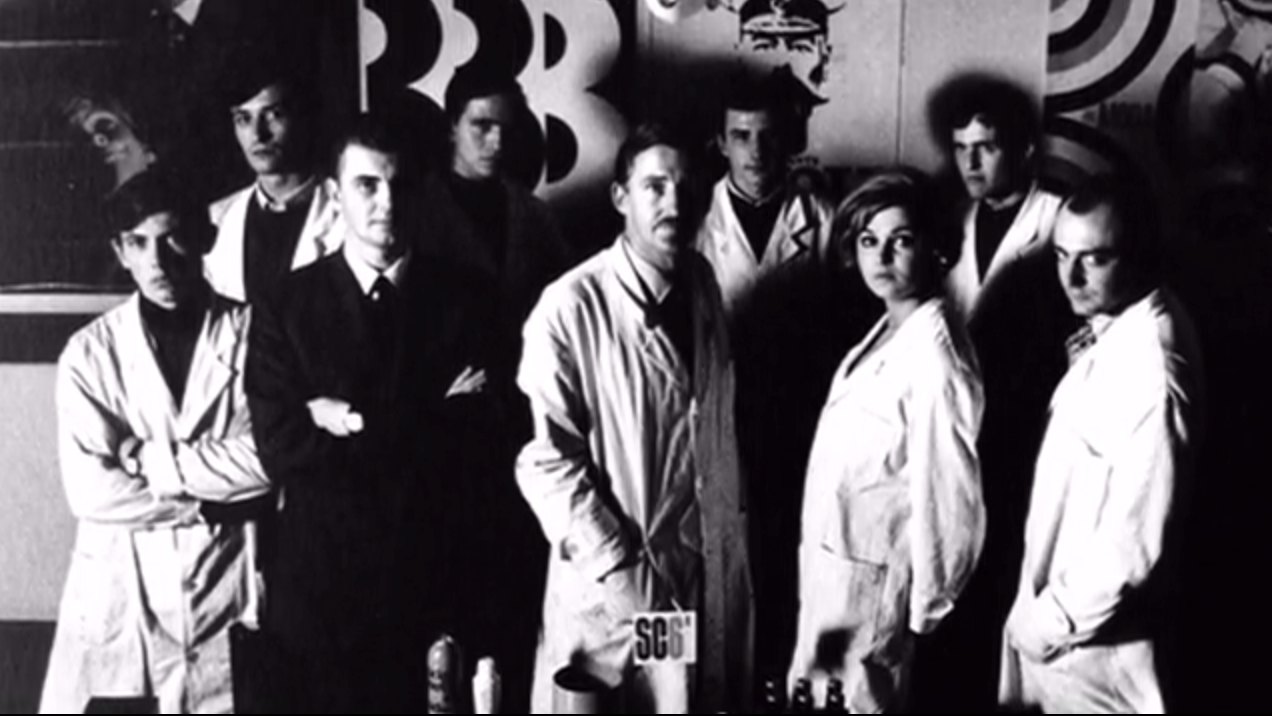
In the late sixties the transit authority finally hired designers Massimo Vignelli and Bob Noorda (Unimark) to organize this organically evolved chaos and devise a new system for wayfinding in New York’s subway system. When the work was finished in 1970 with the publication of the Graphic Standards Manual, it not only succeeded in its initial goals, but also became a timeless example of great design elegantly solving a real problem.
The solution was to unify all of the various styles of conveying directions and wayfinding into a single iconic graphic standard that helps you effortlessly find your way around New York to this day, enabling you to focus on your journey as opposed to focusing on deciphering signs.
OK, that’s cool, but what does all this have to do with science?
Hold on, we’re getting there. A few days later I was, coincidentally, reading up on the history of information and data visualization while working on a project at PLOS visualizing article metrics in various ways, when I stumbled on this little hidden treasure:
... a set of standards and rules for graphic presentation was finally adopted by a joint committee (Joint Committee on Standards for Graphic Presentation, 1914)
Uhm, what? What standards? I have never heard of standards in graphic presentation, i.e. standards for charts and figures. What is all this about? And with this question a journey into the knowledge black hole began.
First, let’s find this document from 1914: http://www.jstor.org/stable/pdfplus/2965153.pdf2. Ideally, I’d like you to send this PDF to your tablet or print it out, make a cup of tea, take few deep breaths, jump on the couch and just read it through. It's only 10 pages and all pages are heavily illustrated (another way of saying there’s lots of pretty pictures).
This document was produced by a committee of several really smart people from all branches of science and engineering, people and organizations like Willard Brinton (chairman) from the American Society of Mechanical Engineers (of Graphic Presentation fame), the American Mathematical Society, the American Statistical Association, American Genetic Association, American Association for the Advancement of Science, and so on. I hope I’ve made the point that this was a very capable group people coming together for a common cause.
So what does this document contain? It begins with a great thought and rationale for standardizing scientific graphics:
If simple and convenient standards can be found and made generally known, there will be possible a more universal use of graphic methods with a consequent gain to mankind because of the greater
speed and accuracy with which complex information may be
imparted and interpreted.
That's exactly what the Graphic Standards Manual achieved for the subway system, unifying how information is conveyed and thereby significantly speeding up and simplifying its use, to the point where you don’t think about how the information is presented, but instead think only about the information itself. And this is the link between the New York transit authority’s efforts, and the efforts of the scientific community a hundred years ago. With one major, critical distinction: While the Graphics Standards Manual is still successfully being used today, the efforts of the Joint Committee on Standards for Graphic Presentation have been eroded by the sands of time and simply forgotten.
There are a lot of other pearls of wisdom to be found in this work, but there is one in particular that stood out:

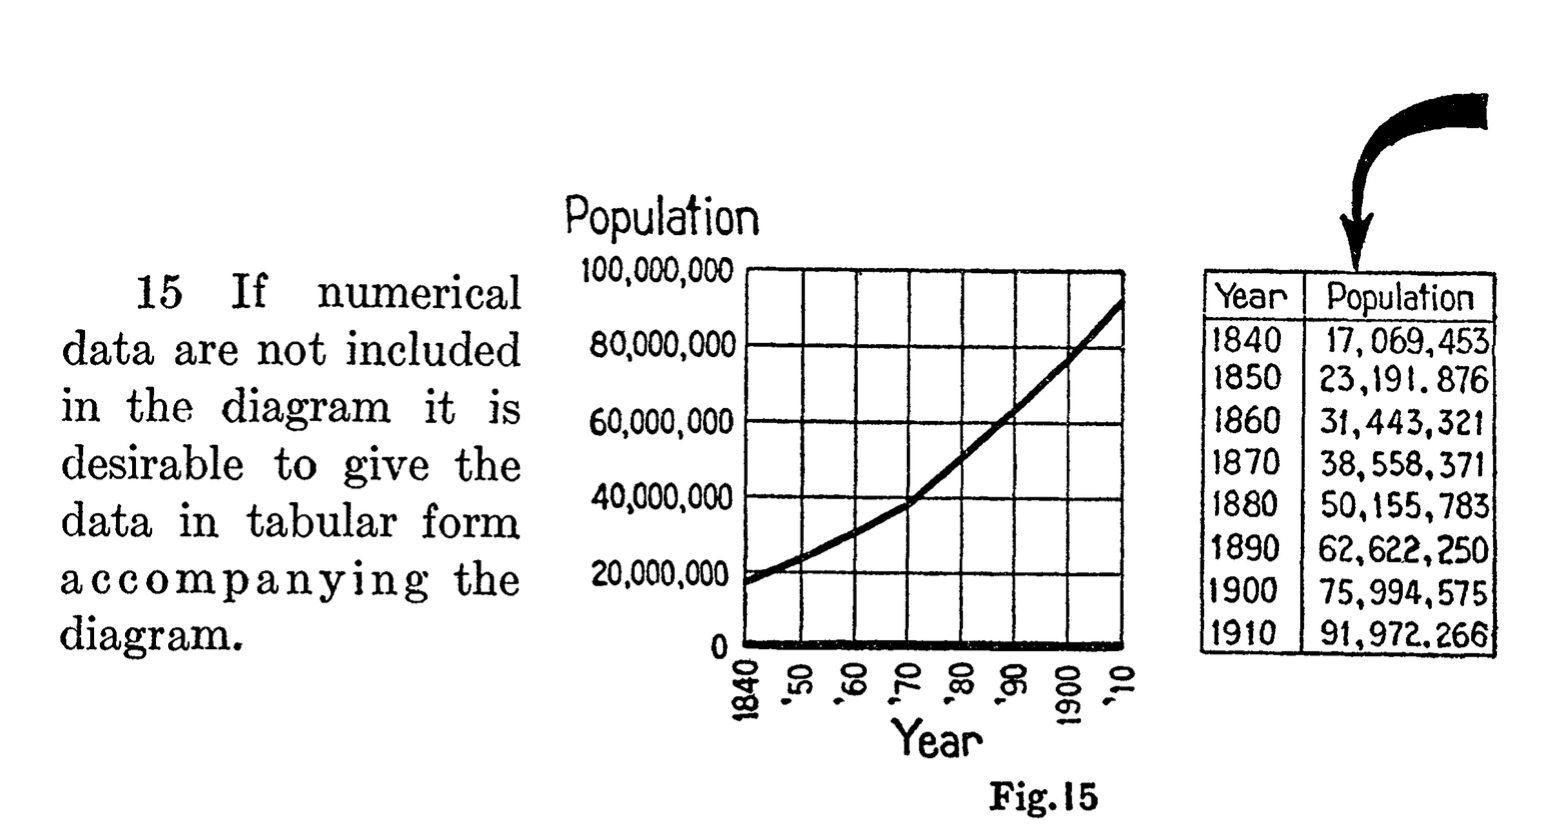
This is essentially saying that data should accompany the figure. A hundred years later, we’re still far from applying this simple but powerful rule. Projects like The Content Mine expend a tremendous amount of energy trying to get data back from figures, and even then it’s a very lossy process. All of that could be avoided if we just follow this one simple rule.
It’s clear these people know what they’re talking about and it makes sense to try and find more of their work. After a lot more digging, I found that this was not the last time this committee convened. In Calvin F. Schmid's highly recommended review of "The Role of Standards in Graphic Presentation"3, it’s mentioned briefly that several more meetings were held:
Since the publication, in 1915, of the report by the original Joint Committee, other committees prepared expanded reports on the standards of graphic presentation in 1936, 1938 and 1960.
We need to find these documents as well. This, however, is not easy. In fact, I’ve only managed to find the 1938 report4 online. Consider this a call for help: If you have any ideas about how to locate the 1936 and 19605 documents (titled "Time-series charts"), please let me know. Additionally, upon further research I discovered there was one more publication, a final revision in 1979 of what was at that point an actual ANSI standard Y15.2M6. This document cannot be found online either, and is available only in select libraries in the States.
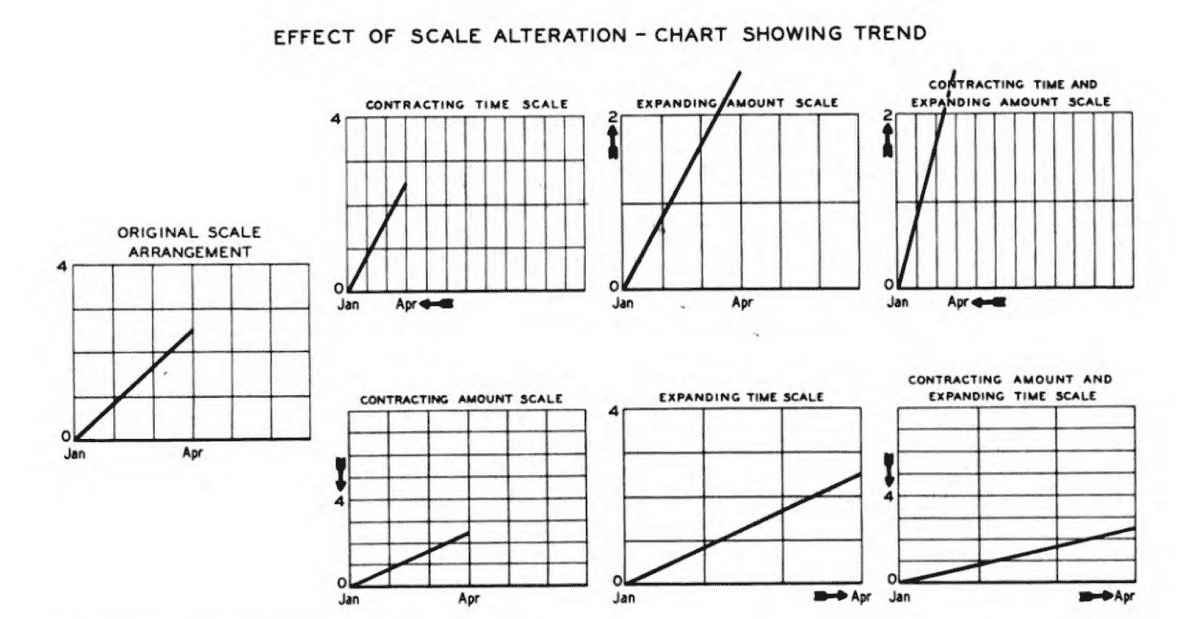
But let’s work with what we have: The 1938 revision is an incredible piece of work. It addresses everything you could possibly think of in terms of how to construct your charts. From good composition practices, such as centering a chart around an optical center, to usage of grids, inclusion of a 0 baseline to avoid perceptual distortion, the importance of scale selection, labeling of axes and curves, reference notes, line styles, and so much more. Can we use this knowledge to improve the presentation of scientific data today? Absolutely.

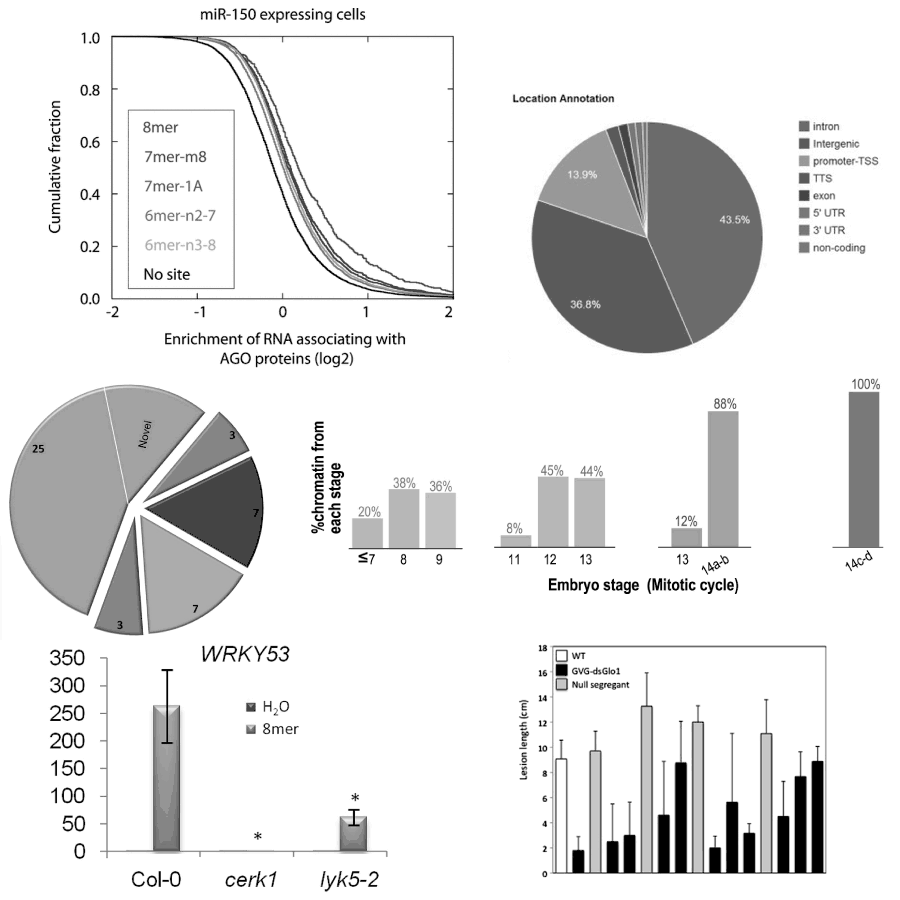
Like the New York subway system in early 1960s, scientific figures are currently in a very chaotic state There are significant differences in presentation of the same types of data, which undoubtedly results in a loss of efficiency when researchers are interpreting this information. A bar chart is a bar chart, a line chart is a line chart and a scatter plot is a scatter plot and yet they are constructed in a million different ways.

On top of that, some other common issues are7:
- There are too many lines packed on a single line chart.
- The charts are needlessly ornamented with things like gradients or 3D effects.
- The axis is missing or constructed in a non-intuitive way, or the baseline is missing.
- The data is not included in the figure.
- An improper chart type is selected.
All of these issues have been addressed in significant detail in the documents mentioned and while a lot of best practices have been established organically, there is simply no excuse for forgetting the vast knowledge that was painstakingly created so many years ago. Additionally, while it was possibly a bigger effort to follow these standards a hundred years ago, when each figure was drawn by hand, it is technically possible to follow these standards with a single click today. In fact, with the technical capabilities we have, it's unforgivable that we still allow figures to be flattened and mushed together into compressed images when they are prepared for publication. But I digress.
Show ... me ... the example!
I had a difficult time finding a figure which would be easy to rebuild using modern technology, purely because the data necessary to recreate figures is almost never available. One bright example which does include data is, not surprisingly, Heather Piwowar's paper on the open data citation advantage. Following some standards found in the documents and using some modern tools, I decided to rebuild Figure 2 of that paper:
This is an interactive figure, which also has data included. If you click on the data link, you will automatically download the data that is presented, in a JSON format.
This is of course a simple example, but there are many such simple charts in scientific papers and it is not a significant effort to recreate them following a century old standards. Except for the fact that the data is not available.
What can we do next?
As a first step, we should bring this historic knowledge back to life. Find copies of the reports and digitize them, upload them to archive.org so that they may never disappear again.
Second, given the breadth of the material found and of the material remaining to be found, it will take some time to study all of it. If you are interested in helping with that, drop me a note. The creation of these standards was a community effort and such should be their modernization. Things like interactivity and modern ways to include data should be discussed as well.
Third, the problem of the way we create scientific charts and figures should simply be recognized. The mistakes of flattening each figure and compressing it, mangling the data, converting vector illustrations into raster images - all of those should be recognized and addressed. Only by recognizing that this is an actual problem, and acknowledging that we do have the means to fix this problem, will we be able to progress.
Fourth, we should connect efforts such as http://metricsgraphicsjs.org, http://idl.cs.washington.edu/projects/lyra/, Datawrapper and so many more. Modernizing scientific data presentation is our common goal.
Conclusion
Sometimes it makes sense to listen to the old masters. The issue of graphic presentation is certainly one where we’ve ignored their efforts and we should try and correct that.
The reconciliation can start with you.
Notes
- I did not actually ride the subway in the 1960s, but would be happy to learn what the experience was like from anyone who did.
- Joint Committee on Standards for Graphic Presentation. Publications of the American Statistical Association, Vol. 14, No. 112 (Dec., 1915), pp. 790-797. Published by: Taylor & Francis, Ltd. on behalf of the American Statistical Association. Article DOI: 10.2307/2965153. Article Stable URL: http://www.jstor.org/stable/2965153
- Graphic Presentation of Statistical Information: Papers Presented at the 136th Annual Meeting of the American Statistical Association, Social Statistics Section : Session of Graphical Methods for Presenting Statistical Data : Boston, Massachusetts, August 23-26, 1976
- American Society of Mechanical Engineers. (1938). Time series charts: a manual of design and construction. American standard. Approved by American standards association, November 1938. New York: Committee on Standard for Graphic Presentation, American Society of Mechanical Engineers.
- American Standards Association., & American Society of Mechanical Engineers. (1960). Time-series charts. New York: American Society of Mechanical Engineers.
- American National Standards Institute., & American Society of Mechanical Engineers. (1979). Americal national standard: Time-series charts. New York: American Society of Mechanical Engineers.
- I’ve made the examples black and white, to further emphasize some of the accessibility issues

